DATA_CO SUPPLY CHAIN ANALYSIS
Table of contents
- Objective
- Data Source
- Stages
- Design
- Development
- Testing
- Exploratory Data Analysis in PostgreSQL
- Visualization
- Analysis
- Recommendations
- Conclusion
OBJECTIVE
The Business Strategy Manager wants to gain deeper insights into customer purchasing patterns, product sales performance, and shipping efficiency to optimize business operations in the future years. The goal is to use exploratory data analysis using postgreSQL and build a dashboard that provides key metrics on:
- Customer behavior (purchasing trends, segmentation, and market distribution)
- Product sales performance (best-selling products, worse selling products)
- Shipping efficiency (late delivery risk, delivery status, and shipping time analysis) This will help the business identify top-performing products, target high-value customers, and improve delivery efficiency, ensuring data-driven decisions that enhance overall profitability and customer satisfaction.
DATA SOURCE
The data is sourced from Kaggle (an Excel extract), see here to find it.
STAGES
- Design
- Development
- Testing
- Analysis
DESIGN
Dashboard Component Requirement
Two dashboards using tableau to help the Business Strategy manager to analyze sales performance and customer Performance.
Sales Dashboard
The purpose of sales dashboard is to present an overview of the sales metrics and trends in order to analyze year-over-year sales performance and understand sales trends.
KEY REQUIREMENT
KPI Overview Display a summary of total sales, profits and quantity for the current year and the previous year.
Sales Trends – Present the data for each KPI on a monthly basis for both the current year and the previous year.
Data analytics services – Identify months with highest and lowest sales and make them easy to recognize.
Product category Comparison – Compare sales performance by different product categories for the current year and the previous year. – Include a comparison of sales with profit.
Weekly Trends for Sales & Profit – Present weekly sales and profit data for the current year. – Display the average weekly values. – Highlight weeks that are above and below the average to draw attention to sales & profit performance
Customer Dashboard
The customer dashboard aims to provide an overview of customer data, trends and behaviors. It will help marketing teams and management to understand customer segments and improve customer satisfactions.
KEY REQUIREMENT
KPI Overview
Display a summary of total number of customers, total sales per customer and total number of orders for the current year and the previous year.
Customer Trends – Present the data for each KPI on a monthly basis for both the current year and the previous year. – Identify months with highest and lowest sales and make them easy to recognize.
Customer Distribution by Number of Orders Represent the distribution of customers based on the number of orders they have placed to provide insights into customer behaviour, loyalty and engagement.
Top 10 Customers by profits – Present the top 10 customers who have generated the highest profits for the company. – Show additional information like rank, number of orders, current sales, current profit and the last order date.
Design & Interactivity Requirements
Dashboard Dynamic – The Dashboard should allow users to check historical data by offering them the flexibility to select any desired year. – Provide users with the ability to navigate between the dashboards easily. – Make the charts and graphs interactive, enabling users to filter data using the charts.
Data Filters Allow users to filter data by product information like category and subcategory and by location information like region, state and city.
Dashboard Mockup
Some of the data visuals that may be appropriate in answering our questions include;
- KPI Cards
- Line Charts
- Bar Charts
- Dual Line Charts
TOOLS
| Tool | Purpose |
|---|---|
| Excel | Exploring the data |
| PostgreSQL | Further exploration, Cleaning, Testing , analysing the data |
| Tableau | Visualizing the data with interactive dashboards |
| Github | Hosting the project documentation |
DEVELOPMENT
Pseudocode
The general approach in creating this solution from start to finish;
- Get the data
- Explore the data in Excel
- Load the data in PostgreSQL
- Clean the data with SQL
- Test the data with SQL
- Visualize the data in Tableau
- Generate the findings based on the insights
- Write the documentation + commentary
- Publish the data to GitHub Pages
Data Exploration in Excel
- There are at least 10 columns that contain the data needed for the analysis, which signals enough data information from the file without needing to contact the client for any more data.
- The dataset is a large data file with 53 columns and 180520 records.
- Some of the columns have the same records stored. Benefit per order and the order profit per order, order item product price and the product price, order item total and the sales per customer.
- The Column product Description which contains no records which needs to be removed
- Some of the records are in a different language and needs to confirm if they are needed for the analysis to convert them or remove if not.
- There are more data than needed, so some of these columns would need to be removed.
Load data into PostgreSQL
/*
#  Loading the supply_chain data into the database
*/

-- 1.

 Create table supply_chain
(days_for_shipping_real integer,
 days_for_shipment_scheduled integer,
 benefit_per_order double precision,
 delivery_status character varying(255),	 late_delivery_risk integer,
 category_name character varying(255),	 customer_city character varying(255),
 customer_country character varying(255), 	customer_fname character varying(255),
 customer_id integer, 	customer_lname character varying(255),
 customer_segment character varying(255),	 customer_state character varying(255),
 customer_street character varying(255), 	customer_zipcode  double precision,
 department_id integer, 	department_name character varying(255),
 market character varying(255), 	order_city character varying(255),
 order_country character varying(255),	order_date_dateorders date,
 order_id integer,	order_item_discount  double precision,
 order_item_discount_rate  double precision, 	order_item_id integer,
 order_item_profit_ratio  double precision,	 order_item_quantity integer,
 sales  double precision, 	order_item_total  double precision,
 order_region character varying(255), 	order_state character varying(255),
 order_status character varying(255), 	product_card_id integer,
 product_category_id integer, 	product_name character varying(255),
 product_price  double precision, 	shipping_date_dateorder	date,
 shipping_mode character varying(255)
);

COPY supply_chain from 'C:\temp\supply_chain.csv' delimiter ',' csv header;
The data is loaded into PostgreSQL with the name Supply chain. The Supply chain data has more columns and records and to Reduce Redundancy, Improve Query Performance and Enhance Data Integrity, the data is normalized by creating smaller tables and creating connection between them using the foreign keys. The created tables extracted from the supply chain table are; Customer info, Customer address, Orders, Shipping details, Products, Categories, Departments, Order items and Payments. Nine (9) tables in all. In applying first normal form in database normalization, the customer street was updated to have customer street name and customer street number as well as the order date dateorders was also updated to have different columns for the time and date.
/*
# Creating sub tables out of the supply chain table
# Normalizing for atomicity
*/

-- 1. Creating customer_info
create table customer_info as
(select distinct
customer_id,
customer_country,
customer_fname,
customer_city,
customer_lname,
customer_segment,
customer_state,
customer_zipcode,
customer_street
from supply_chain);

alter table customer_info
add column customer_streetnumber varchar(100) ;

alter table customer_info
add column customer_streetname varchar(100);

update customer_info
set customer_streetnumber = substring (customer_street from '^[0-9]+'),
customer_streetname = LTRIM (regexp_replace (customer_street, '^[0-9]+\s*', '' ));

alter table customer_info
add constraint pk_customer_id primary key (customer_id);


-- 2. creating customer_address table
create table customer_address as
(select distinct
customer_id
customer_country,
customer_state,
customer_city,
customer_zipcode,
customer_streetnumber,
customer_streetname
from customer_info);

alter table customer_address
add column addressid serial;

alter table customer_address
add constraint pk_addressid primary key (addressid),
add constraint fk_customer_id foreign key (customer_id) references
customer_info(customer_id)
on delete cascade
on update cascade;


-- 3. Creating order_items table
create table order_items as
(select distinct
order_item_id,
order_id,
order_item_quantity,
order_item_discount,
order_item_discount_rate,
order_item_total,
order_item_profit_ratio,
benefit_per_order,
product_card_id
from supply_chain);

alter table order_items
add constraint order_item_id primary key (order_item_id);

alter table order_items
add constraint fk_order_id foreign key (order_id) references orders(order_id)
on delete cascade
on update cascade;

alter table order_items
add constraint fk_product_card_id foreign key (product_card_id) references products(product_card_id)
on delete cascade
on update cascade;


-- 4. Creating payments table

create table payments as
 (select distinct
order_id,
sales,
order_item_total,
benefit_per_order
from supply_chain);

-- Adding payment_id column
alter table payments
add column payment_id serial;

alter table payments
add constraint payment_id primary key (payment_id);

alter table payments
add constraint fk_order_id foreign key (order_id) references orders(order_id)
on delete cascade
on update cascade;


-- 5. Creating orders table

create table orders as
(select distinct
order_id,
customer_id,
order_date_dateorders,
order_status,
order_region,
order_city,
order_state,
order_country,
market,
shipping_date_dateorder,
shipping_mode,
delivery_status,
late_delivery_risk
from supply_chain);

SELECT TO_TIMESTAMP('1/1/2015 0:00', 'FMMM/FMDD/YYYY FMHH24:MI');

ALTER TABLE orders
ALTER COLUMN order_date_dateorders TYPE TIMESTAMP
USING TO_TIMESTAMP(order_date_dateorders, 'FMMM/FMDD/YYYY FMHH24:MI');

ALTER TABLE orders
ALTER COLUMN shipping_date_dateorder TYPE TIMESTAMP
USING TO_TIMESTAMP(shipping_date_dateorder, 'FMMM/FMDD/YYYY FMHH24:MI');

alter table orders
add constraint pk_order_id primary key (order_id);

alter table orders
add constraint fk_customer_id foreign key (customer_id) references customer_info(customer_id)
on delete cascade
on update cascade;


-- 6. Creating shipping table

create table shipping_details as
(select distinct
order_id,
shipping_date_dateorder,
shipping_mode,
delivery_status,
late_delivery_risk
from orders);

alter table shipping_details
add column shipping_id serial;

alter table shipping_details
add constraint pk_shipping_id primary key (shipping_id);

alter table shipping_details
add constraint fk_order_id foreign key (order_id) references orders(order_id)
on delete cascade
on update cascade;


-- 7. Creating a products table

create table products as
(select distinct
product_card_id,
product_name,
product_category_id,
product_price
from supply_chain);

alter table products
add constraint pk_product_card_id primary key (product_card_id);

alter table products
add constraint fk_product_category_id foreign key (product_category_id) references categories(product_category_id)
on delete cascade
on update cascade;


-- 8. Creating categories table

create table categories as
(select distinct
product_category_id,
category_name,
department_id,
department_name
from supply_chain);

alter table categories
add constraint product_category_id primary key (product_category_id);

alter table categories
add constraint fk_department_id foreign key (department_id) references departments(department_id)
on delete cascade
on update cascade;


-- 9. Creating departments table

create table departments as
(select distinct
department_id,
department_name
product_category_id
from supply_chain);

alter table departments
add constraint pk_department_id primary key (department_id);
Relationship between tables
| Table Name | Primary Key (PK) | Foreign Key (FK) | Relationship |
|---|---|---|---|
| Customer Info | customer id | address id | 1:1 customer address |
| Customer Address | address id | - | 1: 1 with customer Info |
| Orders | order id | customer id | N: 1 with Customer info |
| Shipping details | shipping id | order id | 1: 1 with Orders |
| Order items | order item id | order id, product card id | N :1 with Orders |
| Products | product card id | product category id | N : 1 Categories |
| Categories | product category id | department id | N :1 Department |
| Departments | department id | - | 1 : N with Categories |
| Payments | payment id | order id | 1: 1 with Orders |
Data Exploration in PostgreSQL
- There were inconsistencies in the customer street, customer zip-code and customer state for the following customer ids; 17171, 14046, 14577.
- The data contains record of 1710 customers with customer_fname as Mary and Customer_lname as Smith having different addresses.
- The customer Mary Smith has two records of data with different customer id, having the same customer_city, customer_country, customer_fname, customer_lname, customer_segment, customer_state, customer_zipcode and customer_street for eleven records. The difference between this eleven records is the customer street address.
Data Cleaning
A cleaned data should meet the following criteria and constraints:
- Only relevant columns should be retained.
- All data types should be appropriate for the contents of each column.
- No column should contain null values, indicating complete data for all records.
- The data should be without duplicate. And to achieve that;
- The following columns were removed during the data exploration stage in excel; customer email, customer password, Product status, sales per customers, latitude, longitude, order profit per order, order item product price.
- There were null values in the customer lname column which was updated with ‘Unknown’
- The customer city for customer id 17171 and 14577 was updated with ‘Elk Grove’ and that of customer id 14046 was updated with ‘El Monte’
- The customer zipcode for customer id 17171 and 14577 was updated with 95758 and that of customer id 14046 was updated with 91732.
- The customer state for the customer id 17171, 14577 and 14046 was updated as ‘CA’ and their customer Street set as ‘Unknown’
- Suspected customers with different customer ids were updated and deleted accordingly.
/*
# 1. Checking for inconsistencies and errors
# 2. duplicates check
*/

-- 1.
update customer_info
set customer_lname = 'Unknown'
where customer_lname is null;

update customer_info
set customer_country ='USA'
where customer_country = 'EE. UU.';

update customer_info
set customer_city = 'Elk Grove'
where customer_id = 17171 and customer_fname = 'Eugenia'

update customer_info
set customer_city = 'Elk Grove'
where customer_id = 14577 and customer_fname = 'Sara'

update customer_info
set customer_city = 'El Monte'
where customer_id = 14046 and customer_fname = 'Zena'

update customer_info
set customer_zipcode = '95758'
where customer_id = 17171 and customer_fname = 'Eugenia'

update customer_info
set customer_zipcode= '95758'
where customer_id =14577 and customer_fname ='Sara'

update customer_info
set customer_zipcode = '91732'
where customer_id = 14046 and customer_fname = 'Zena'

update customer_info
set customer_state = 'CA'
where customer_id = 17171 and customer_fname = 'Eugenia'

update customer_info
set customer_state= 'CA'
where customer_id =14577 and customer_fname ='Sara'

update customer_info
set customer_state = 'CA'
where customer_id = 14046 and customer_fname = 'Zena'

update customer_info
set customer_street = 'Unknown'
where customer_id = 17171 and customer_fname = 'Eugenia'

update customer_info
set customer_street= 'Unknown'
where customer_id =14577 and customer_fname ='Sara'

update customer_info
set customer_street = 'Unknown'
where customer_id = 14046 and customer_fname = 'Zena'

update customer_info
set customer_streetnumber = 'Unknown'
where customer_id = 17171 and customer_fname = 'Eugenia';

update customer_info
set customer_streetnumber = 'Unknown'
where customer_id = 14577 and customer_fname = 'Sara';

update customer_info
set customer_streetnumber = 'Unknown'
where customer_id = 14046 and customer_fname = 'Zena';

alter table customer_info
drop column customer_street,
drop column customer_city,
drop column customer_country,
drop column customer_state,
drop column customer_zipcode,
drop column customer_streetname,
drop column customer_streetnumber;

UPDATE orders
SET order_country = CASE
    WHEN order_country = 'Egipto' THEN 'Egypt'
    WHEN order_country = 'Estados Unidos' THEN 'USA'
    WHEN order_country = 'Afganistán' THEN 'Afghanistan'
    WHEN order_country = 'Alemania' THEN 'Germany'
    WHEN order_country = 'Arabia Saudí' THEN 'Saudi Arabia'
    WHEN order_country = 'Argelia' THEN 'Algeria'
    WHEN order_country = 'Azerbaiyán' THEN 'Azerbaijan'
    WHEN order_country = 'Bélgica' THEN 'Belgium'
    WHEN order_country = 'Baréin' THEN 'Bahrain'
    WHEN order_country = 'Bangladés' THEN 'Bangladesh'
    WHEN order_country = 'Belice' THEN 'Belize'
    WHEN order_country = 'Bielorrusia' THEN 'Belarus'
	WHEN order_country = 'Bosnia y Herzegovina' THEN 'Bosnia and Herzegovina'
	WHEN order_country = 'Brasil' THEN 'Brazil'
	WHEN order_country = 'Bután' Then 'Bhutan'
	WHEN order_country = 'Botsuana' THEN 'Botswana'
	WHEN order_country = 'Chipre' THEN 'Cyprus'
	WHEN order_country = 'Emiratos Árabes Unidos' THEN 'United Arab Emirates'
	WHEN order_country = 'España' THEN 'Spain'
	WHEN order_country = 'Gabón'  THEN 'Gabon'
	WHEN order_country = 'Etiopía' THEN 'Ethiopia'
	WHEN order_country = 'Japón' THEN 'Japan'
	WHEN order_country = 'Irán' THEN 'Iran'
	WHEN order_country = 'Irak' THEN 'Iraq'
	WHEN order_country = 'Kazajistán' THEN 'Kazakhstan'
	WHEN order_country = 'República Dominicana' THEN 'Dominican Republic'
	WHEN order_country = 'Sáhara Occidental' THEN 'Sahara Occidental'
	ELSE order_country END
WHERE order_country IN ('Egipto','Estados Unidos','Afganistán', 'Alemania', 'Arabia Saudí',
                        'Argelia','Azerbaiyán', 'Bélgica', 'Baréin', 'Bangladés', 'Belice',
						'Bielorrusia','Bosnia y Herzegovina', 'Brasil', 'Bután', 'Botsuana',
						'Chipre', 'Emiratos Árabes Unidos','España', 'Gabón','Etiopía','Japón',
						'Irán', 'Kazajistán', 'República Dominicana', 'Sáhara Occidental' );


-- 2. identying duplicate records of same customers with different customer_id
select distinct
customer_city,
customer_country,
customer_fname,
customer_lname,
customer_segment,
customer_state,
customer_zipcode,
customer_street,
count (*) as num_record,
STRING_AGG (customer_id ::TEXT ,',') as customer_ids
from customer_info
group by
customer_city,
customer_country,
customer_fname,
customer_lname,
customer_segment,
customer_state,
customer_zipcode,
customer_street
having count (*)>1
order by num_record DESC;


-- assigning a single customer_id for customers with double customer id
UPDATE orders
SET customer_id = CASE
    WHEN customer_id = 12024 THEN 5286
    WHEN customer_id = 9619 THEN 1495
    WHEN customer_id = 4243 THEN 3765
    WHEN customer_id = 7674 THEN 2005
    WHEN customer_id = 1722 THEN 1493
    WHEN customer_id = 1851 THEN 344
    WHEN customer_id = 11557 THEN 11866
    WHEN customer_id = 9358 THEN 2083
    WHEN customer_id = 3861 THEN 6840
    WHEN customer_id = 5498 THEN 1954
    WHEN customer_id = 5486 THEN 644
    ELSE customer_id
END
WHERE customer_id IN (12024, 9619, 4243, 7674, 1722, 1851, 11557, 9358, 3861, 5498, 5486);


-- deleting the duplicate records
delete from customer_info
where customer_id in (12024,9619,4243,7674,1722,1851,11557,9358,3861,5498,5486);
Testing
Data Quality Tests
Row Count Check
/*
# Count the total number of records (or rows) are in the SQL view
*/

SELECT 'customer_info' AS table_name, COUNT(*) AS number_of_rows FROM customer_info
UNION ALL
SELECT 'customer_address', COUNT(*) FROM customer_address
UNION ALL
SELECT 'categories', COUNT(*) FROM categories
UNION ALL
SELECT 'departments', COUNT(*) FROM departments
UNION ALL
SELECT 'order_items', COUNT(*) FROM order_items
UNION ALL
SELECT 'orders', COUNT(*) FROM orders
UNION ALL
SELECT 'payments', COUNT(*) FROM payments
UNION ALL
SELECT 'products', COUNT(*) FROM products
UNION ALL
SELECT 'shipping_details', COUNT(*) FROM shipping_details;
Output
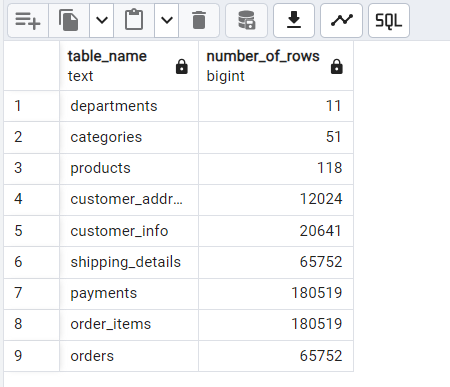
Column Count Check
/*
# Count the total number of columns are in the SQL view
*/

SELECT table_name, COUNT(column_name) AS column_count
FROM information_schema.columns
WHERE table_name IN ('customer_info', 'customer_address', 'orders',
                     'shipping_details', 'products', 'categories',
                     'departments', 'order_items', 'payments')
GROUP BY table_name
ORDER BY table_name;
Output
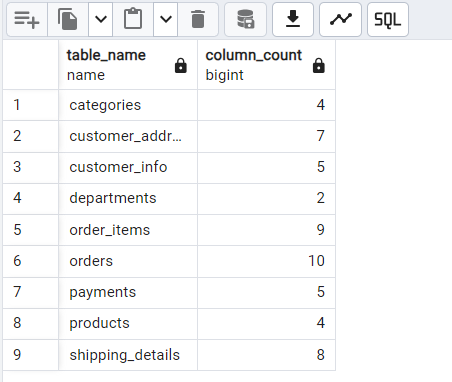
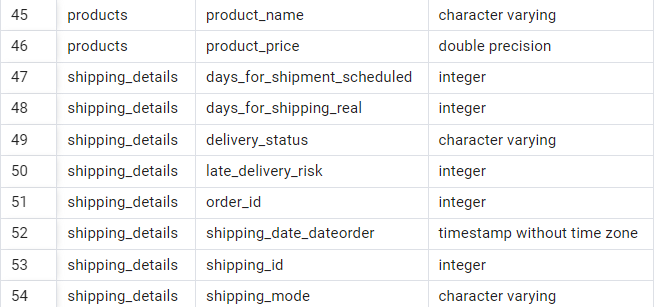
Data Type Check
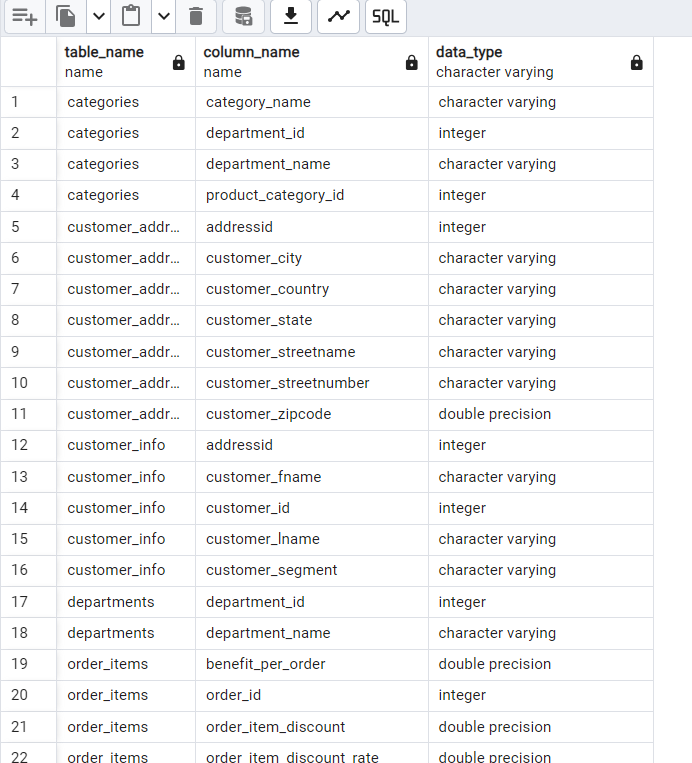
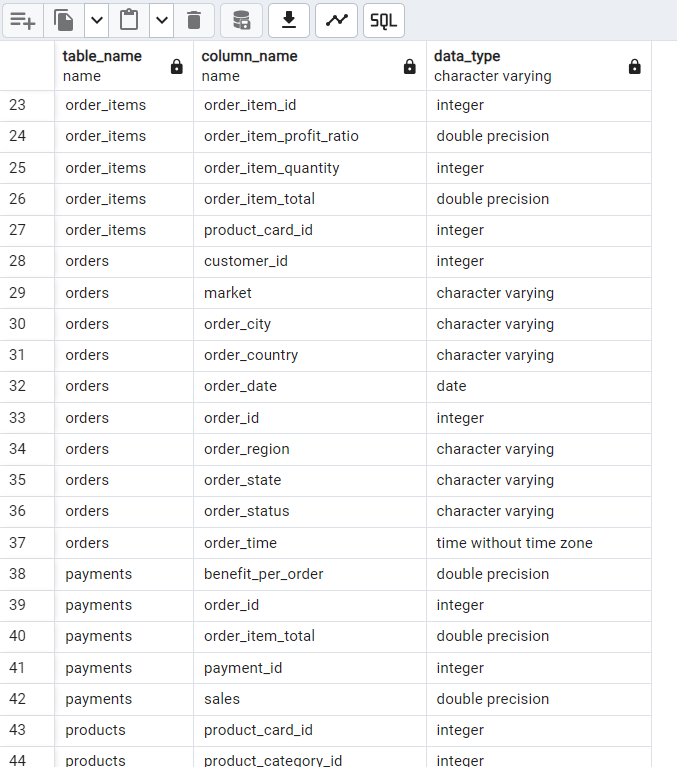
/*
# Data Type Check
*/

SELECT
    table_name,
    column_name,
    data_type
FROM information_schema.columns
WHERE table_name IN ('customer_info', 'customer_address',
                     'categories', 'departments', 'order_items',
                     'orders', 'payments', 'products', 'shipping_details')
ORDER BY table_name, column_name;
Output
Duplicate Check
/*
# Duplicate Check
*/

SELECT *, COUNT(*)
FROM supply_chain
GROUP BY days_for_shipping_real, days_for_shipment_scheduled, benefit_per_order, delivery_status,
         late_delivery_risk, category_name, customer_city, customer_country, customer_fname,
         customer_id, customer_lname, customer_segment, customer_state, customer_street,
         customer_zipcode, department_id, department_name, market, order_city, order_country,
         order_date_dateorders, order_id, order_item_discount, order_item_discount_rate,
         order_item_id, order_item_profit_ratio, order_item_quantity, sales, order_item_total,
         order_region, order_state, order_status, product_card_id, product_category_id,
         product_name, product_price, shipping_date_dateorder, shipping_mode
HAVING COUNT(*) > 1;
Output

Exploratory data Analysis in PostgreSQL
Outputs for the higher cardinality dimensions are not shown.
Dimensions explorations
/*
# 1. Explore all countries the customers come from
# 2. Explore all categories 'major Divisions'
# 3. Explore the various departments
# 4. Various Countries the orders come from
# 5. Various Shipping Modes
# 6. Various Delivery Status
*/

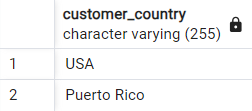
select distinct customer_country from customer_address;

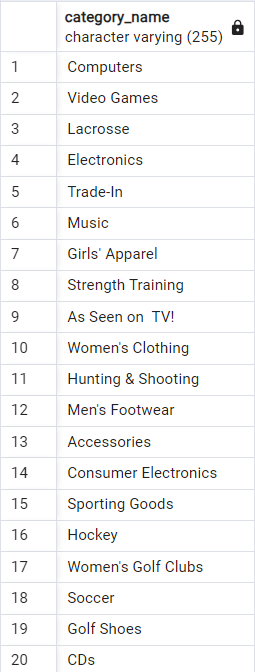
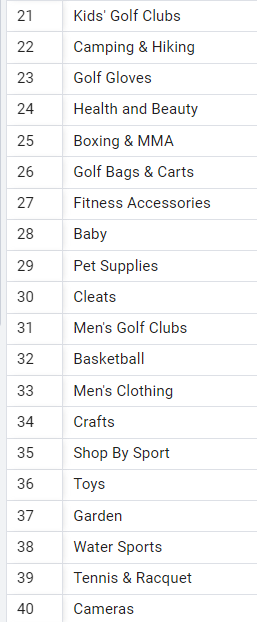
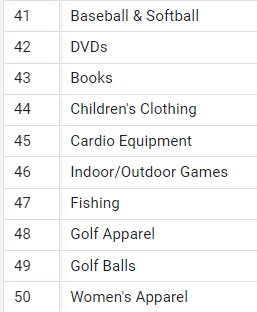
select distinct category_name from categories;

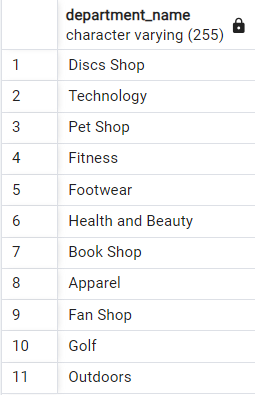
select distinct department_name from departments;

select distinct order_country from orders;

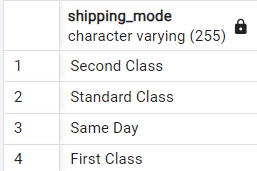
select distinct shipping_mode from shipping_details;

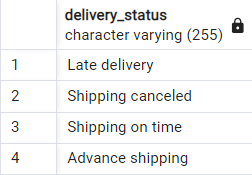
select distinct delivery_status from shipping_details;
Output
– 1. Distinct Customer Countries
– 2. Distinct Categories
– 3. Distinct Departments
– 4. Distinct Order Country is of higher cardinality dimensions.
– 5. Distinct Shipping Modes
– 6. Distinct Delivery Status
Date Exploration
/*
# Date Exploration for the number of years of sales available with the first and last order
*/

SELECT
    MIN(order_date) AS first_order_date,
    MAX(order_date) AS last_order_date,
    EXTRACT(YEAR FROM AGE(MAX(order_date), MIN(order_date))) AS order_range_years
FROM orders;
Output

Measures Exploration (KPI)
/*
# 1. Total Sales
# 2. Total Profit
# 3. Total number of Items sold
# 4. Average Selling Price
# 5. Total number of Orders
# 6. Total Number of orders from different Customers
# 7. Total Number of Products
# 8. Total Number of Customers to place order
# 9. Total number of countries the orders came from
*/

SELECT sum (sales) as total_sales from payments;

SELECT sum (benefit_per_order) as total_profit from order_items;

SELECT sum (order_item_quantity) as total_quantity from order_items;

SELECT avg(product_price) as avg_price from products;

SELECT count (order_id) as total_orders from order_items;

SELECT count (distinct order_id) as total_orders from order_items;

SELECT count (product_card_id) as total_products from products;

SELECT count (customer_id) as total_customers from customer_info;

SELECT count (distinct order_country) from orders;

select 'Total Sales' as measure_name, sum (sales) as measure_value from payments
Union All
select 'Total Profit' as measure_name, sum (benefit_per_order) as measure_value from order_items
Union All
select 'Total Quantity' as measure_name, sum (order_item_quantity) as measure_value from
order_items
Union All
select 'Average_Price' as measure_name, avg(product_price) as measure_value from products
Union all
select 'Total Nr. Orders' as measure_name, count (order_id) as measure_value from order_items
Union All
select 'Total Nr. Products' as measure_name, count (product_card_id) as measure_value from
products
Union All
select 'Total Nr. Customers' as measure_name, count (customer_id) as measure_value from
customer_info
Union All
select 'Total Nr. Order Countries' as measure_name, count (distinct order_country) from orders;
Output
Magnitude Analysis
/*
# 1. Total Customers by Countries
# 2. Total Products by Categories
# 3. Average Cost in Each Category
# 4. Total Revenue generated for each Category
# 5. Distribution of Sold Items across Countries (High cardinality dimension)
# 6. On-Time vs. Late Deliveries by Region
# 7. Sales by Market and Customer Segment

*/
-- 1. Total Customers by Countries

select customer_country, count(c.customer_id) as total_customers
from customer_info c
join customer_address ca on c.addressid = ca.addressid
group by customer_country
order by count(customer_id) DESC

-- 2. Total Products by Categories
Select c.category_name, count (p.product_card_id)
from products p
join categories c on c.product_category_id = p.product_category_id
group by category_name
order by 2 desc

-- 3. Average Cost in Each Category
select c.category_name, avg(product_price) as Average_price
from categories c
join products p on c.product_category_id = p.product_category_id
group by c.category_name
order by 2 DESC

-- 4. Total Revenue generated for each Category
select c.category_name, sum (sales) as Total_Revenue
from categories c
Join products pr on c.product_category_id = pr.product_category_id
Join order_items oi on pr.product_card_id = oi.product_card_id
join payments p on oi.order_id = p.order_id
group by category_name
order by 2 DESC;

-- 5. Distribution of Sold Items across Countries (High cardinality dimension)
 select o.order_country, sum (order_item_quantity)as Items_Sold
from orders o
join order_items oi on o.order_id = oi.order_id
group by 1
order by 2 DESC

-- 6. On-Time vs. Late Deliveries by Region
SELECT
    o.order_region,
    COUNT(CASE WHEN s.late_delivery_risk = 1 THEN o.order_id END) AS late_deliveries,
    COUNT(CASE WHEN s.late_delivery_risk = 0 THEN o.order_id END) AS on_time_deliveries,
    COUNT(o.order_id) AS total_orders,
    ROUND(AVG(s.days_for_shipping_real - s.days_for_shipment_scheduled), 2) AS avg_days_late
FROM orders o
JOIN shipping_details s ON o.order_id = s.order_id
GROUP BY o.order_region
ORDER BY late_deliveries DESC;

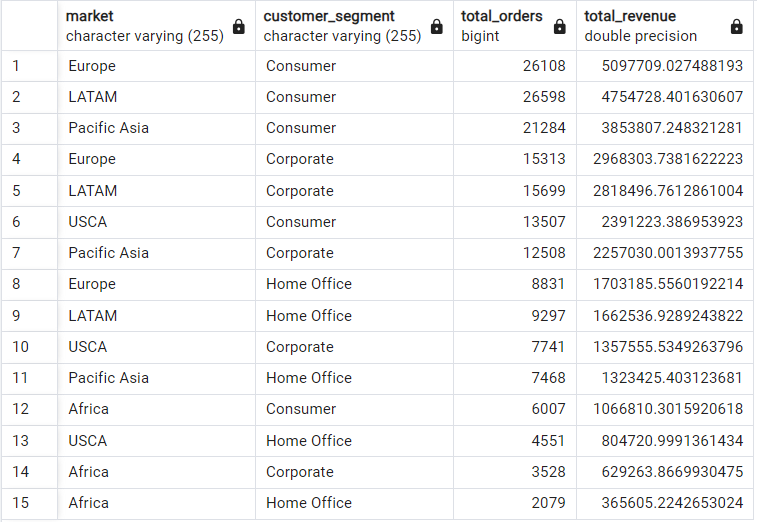
-- 7. Sales by Market and Customer Segment
SELECT
    o.market,
    c.customer_segment,
    COUNT(o.order_id) AS total_orders,
    SUM(oi.order_item_total) AS total_revenue
FROM customer_info c
JOIN orders o ON o.customer_id = c.customer_id
JOIN order_items oi ON o.order_id = oi.order_id
GROUP BY o.market, c.customer_segment
ORDER BY total_revenue DESC;
Output
– 1. Total Customers by Countries
– 2. Total Products by Categories
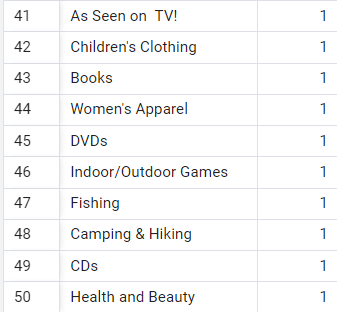
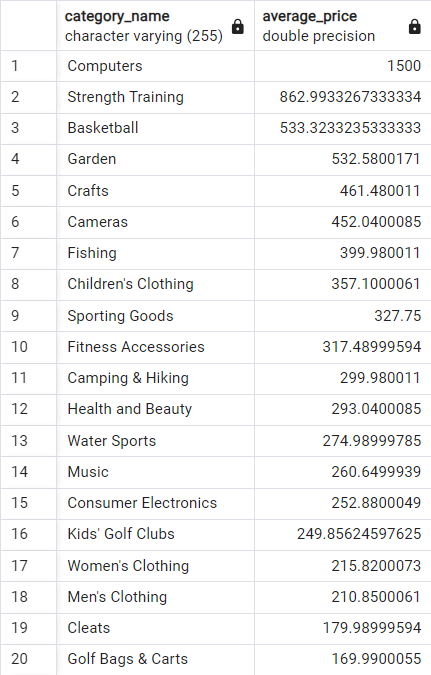
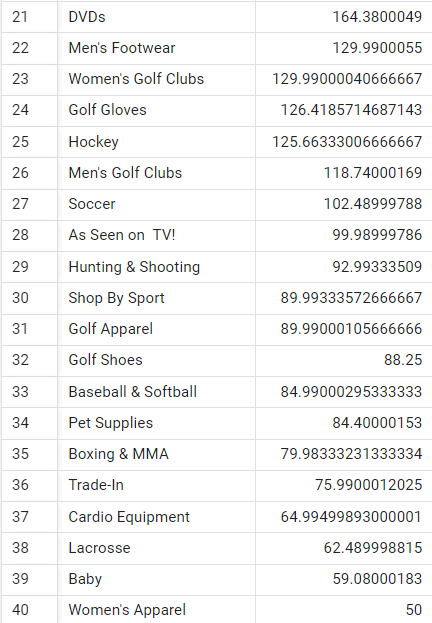
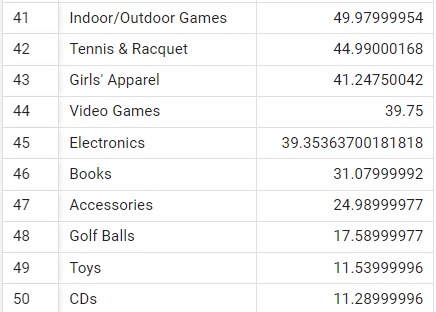
– 3. Average Cost in Each Category
– 4. Total Revenue generated for each Category
– 5. Distribution of Sold Items across Countries (High cardinality dimension)
– 6. On-Time vs. Late Deliveries by Region

– 7. Sales by Market and Customer Segment
Ranking Analysis
/*
# 1. Total Customers by Total Sales
# 2. Top Customers by Total Profit
# 3. Best Selling Products by Quantity Sold
# 4. Worse Selling Products by Quantity Sold
# 5. Most Profitable Products
# 6. Less Profitable Products

*/

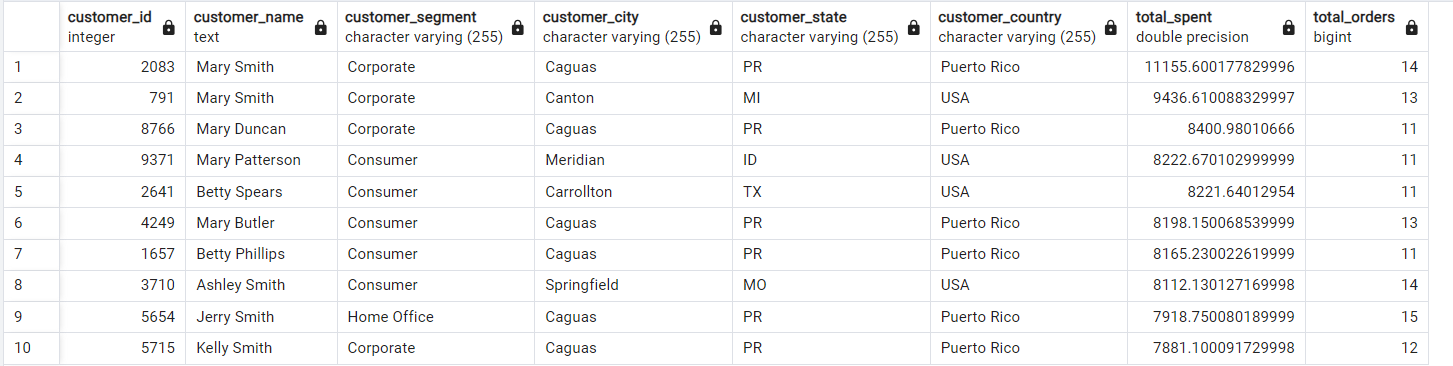
-- 1. Top Customers by Total Sales
SELECT
    c.customer_id,
    CONCAT(c.customer_fname, ' ', c.customer_lname) AS customer_name,
    c.customer_segment,
    ca.customer_city,
    ca.customer_state,
    ca.customer_country,
    SUM(p.sales) AS total_spent,
    COUNT(distinct o.order_id) AS total_orders
FROM customer_address ca
JOIN customer_info c ON ca.addressid = c.addressid
JOIN orders o ON o.customer_id = c.customer_id
JOIN payments p ON o.order_id= p.order_id
GROUP BY c.customer_id, customer_name, c.customer_segment,
ca.customer_city,ca.customer_state, ca.customer_country
ORDER BY total_spent DESC
LIMIT 10;

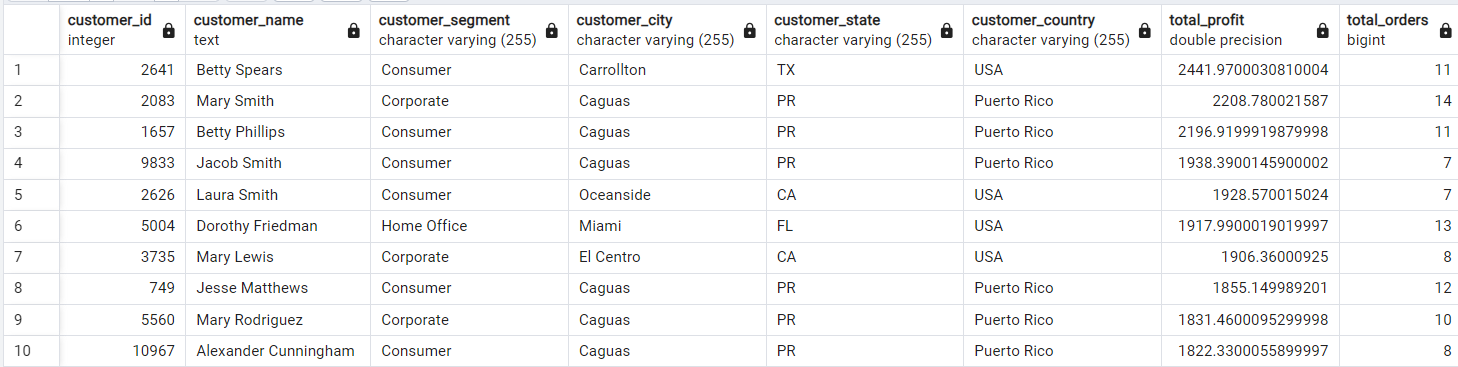
-- 2. Top Customers by Total Profit
SELECT
    c.customer_id,
    CONCAT(c.customer_fname, ' ', c.customer_lname) AS customer_name,
    c.customer_segment,
    ca.customer_city,
    ca.customer_state,
    ca.customer_country,
    SUM(p.benefit_per_order) AS total_profit,
    COUNT(distinct o.order_id) AS total_orders
FROM customer_address ca
JOIN customer_info c ON ca.addressid = c.addressid
JOIN orders o ON o.customer_id = c.customer_id
JOIN payments p ON o.order_id= p.order_id
GROUP BY c.customer_id, customer_name, c.customer_segment,
ca.customer_city,ca.customer_state, ca.customer_country
ORDER BY total_profit DESC
LIMIT 10;


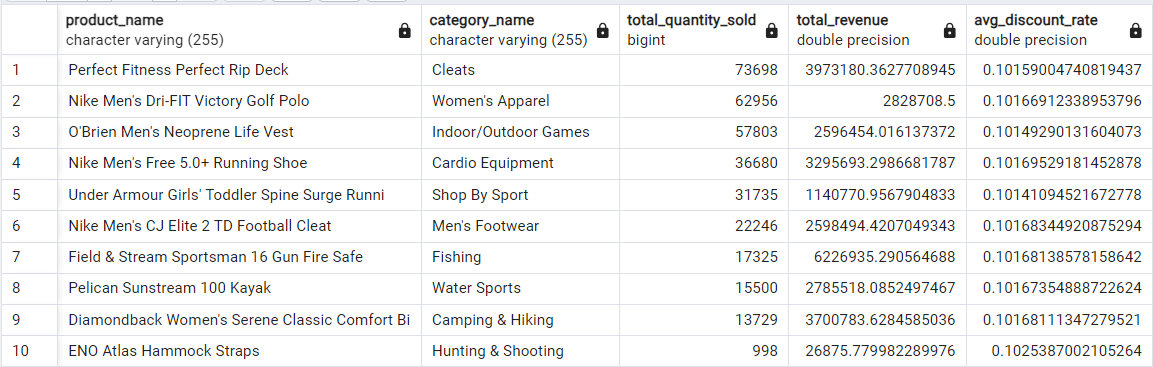
-- 3. Best Selling Products by Quantity Sold
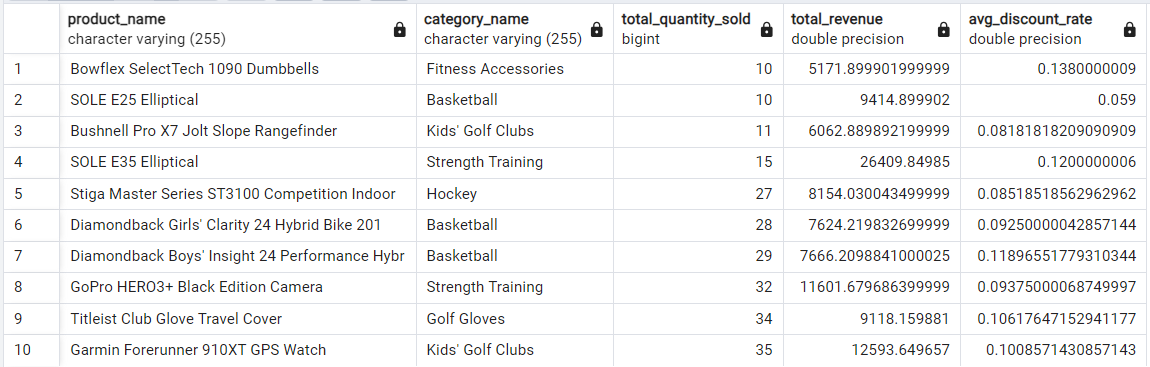
SELECT
    p.product_name,
    c.category_name,
    SUM(oi.order_item_quantity) AS total_quantity_sold,
    SUM(oi.order_item_total) AS total_revenue,
    AVG(oi.order_item_discount_rate) AS avg_discount_rate
FROM products p
JOIN order_items oi ON p.product_card_id = oi.product_card_id
JOIN categories c ON p.product_category_id = c.product_category_id
GROUP BY p.product_name, c.category_name
ORDER BY total_quantity_sold DESC
LIMIT 10;

-- 4. Worse Selling Products by Quantity Sold
SELECT
    p.product_name,
    c.category_name,
    SUM(oi.order_item_quantity) AS total_quantity_sold,
    SUM(oi.order_item_total) AS total_revenue,
    AVG(oi.order_item_discount_rate) AS avg_discount_rate
FROM products p
JOIN order_items oi ON p.product_card_id = oi.product_card_id
JOIN categories c ON p.product_category_id = c.product_category_id
GROUP BY p.product_name, c.category_name
ORDER BY total_quantity_sold
LIMIT 10;

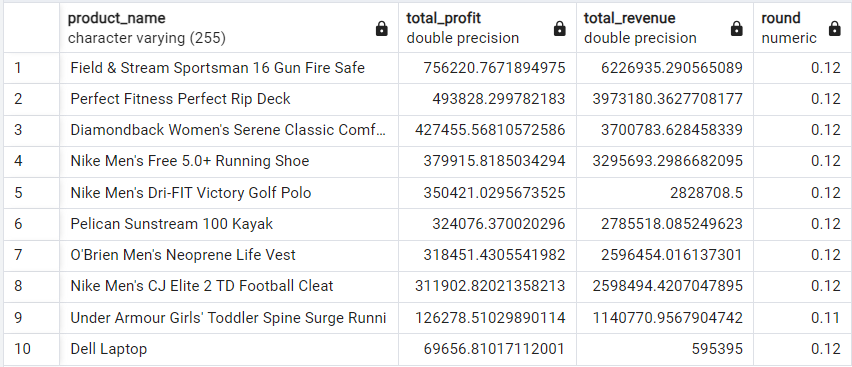
-- 5. Most Profitable Products
SELECT
    p.product_name,
    SUM(oi.benefit_per_order) AS total_profit,
    SUM(oi.order_item_total) AS total_revenue,
   ROUND((SUM(oi.benefit_per_order) / SUM(oi.order_item_total))::NUMERIC, 2)
FROM order_items oi
JOIN products p ON oi.product_card_id = p.product_card_id
GROUP BY p.product_name
ORDER BY total_profit DESC
LIMIT 10;

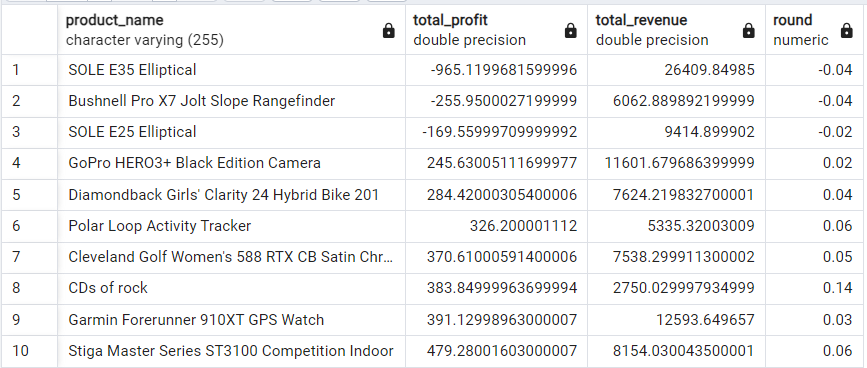
-- 6. Less Profitable Products
SELECT
    p.product_name,
    SUM(oi.benefit_per_order) AS total_profit,
    SUM(oi.order_item_total) AS total_revenue,
   ROUND((SUM(oi.benefit_per_order) / SUM(oi.order_item_total))::NUMERIC, 2)
FROM order_items oi
JOIN products p ON oi.product_card_id = p.product_card_id
GROUP BY p.product_name
ORDER BY total_profit
LIMIT 10;
Output
– 1. Top Customers by Total Sales
– 2. Top Customers by Total Profit
– 3. Best Selling Products by Quantity Sold
– 4. Worse Selling Products by Quantity Sold
– 5. Most Profitable Products
– 6. Less Profitable Products
Visualization

Analysis
Findings
Exploratory Analysis using PostgreSQL
This exploratory analysis provides insights into customer orders, product categories, shipping performance, and revenue distribution over a three-year period (2015–2018). Below are the key findings:
– 1. Customer Insights
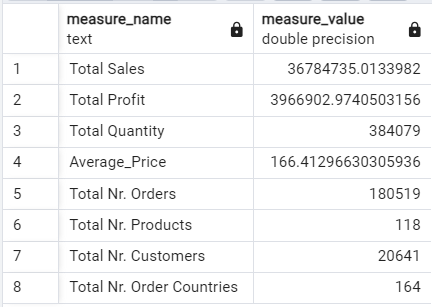
- Orders were made by 20,641 customers from 164 different countries.
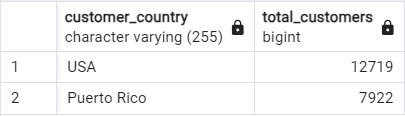
- 12,719 customers were from the USA, and 7,922 customers were from Puerto Rico.
- Despite a global presence, the customers are either Puerto Ricans or American.
– 2. Product Categories & Departments
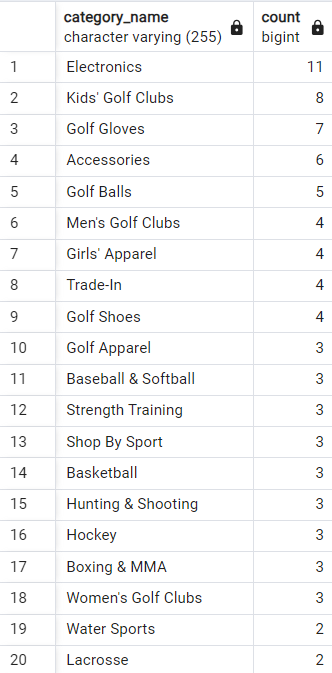
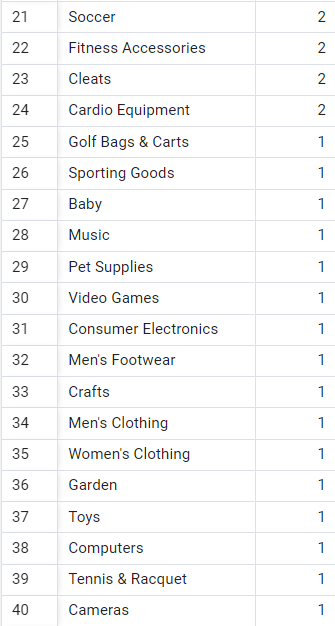
- The dataset includes 50 product categories under 11 departments.
- Electronics had the highest number of products (11), while most categories contained only one product.
- Computers had the highest average price of $1,500, while CDs had the lowest at $11.
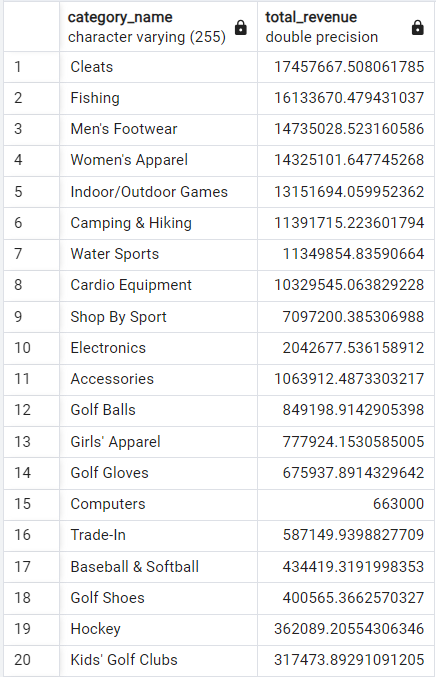
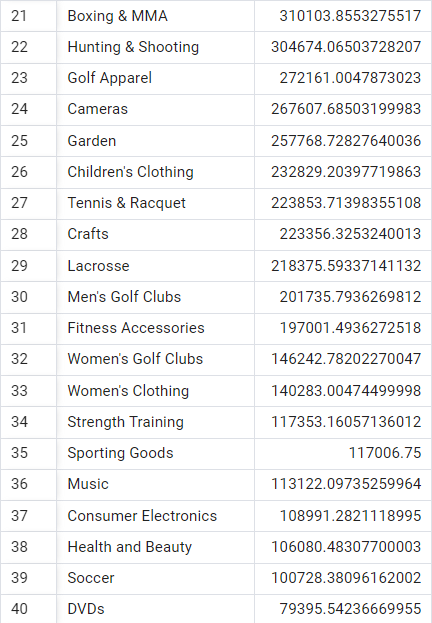
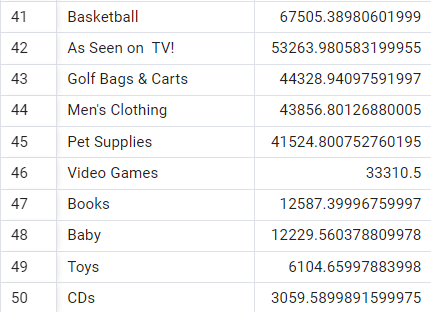
- Cleats generated the most revenue ($17,457,667), while CDs generated the least $3059.
– 3. Sales & Profit Performance
- A total of 180,519 distinct orders were placed, selling 384,079 products.
- Total sales revenue amounted to $36,784,735, with a total profit of $3,966,902.
- The average product price was $166.
– 4. Shipping & Delivery Performance
- There were four shipping modes and four delivery status categories.
- Late deliveries were the highest among all delivery statuses.
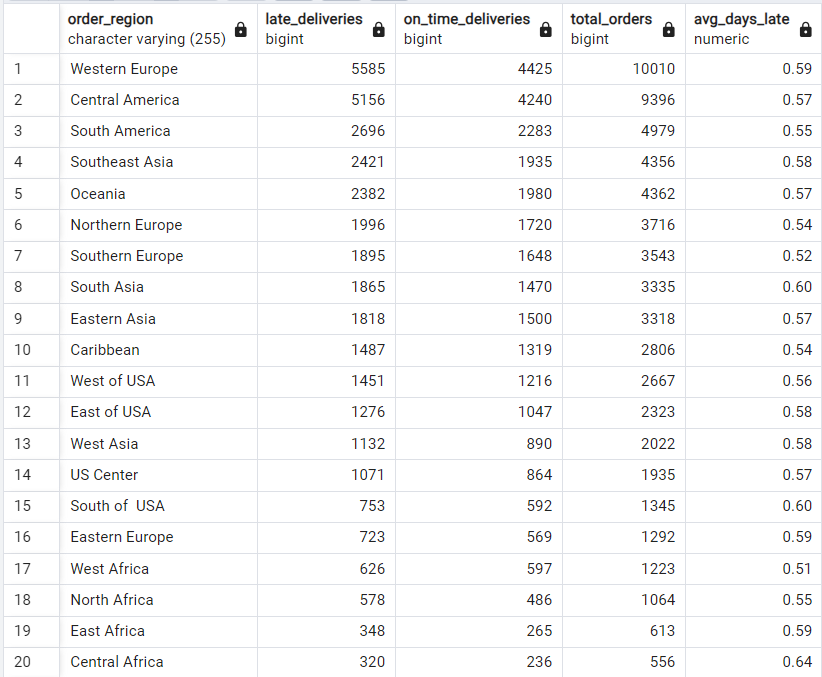
- Central Africa had the fewest orders and worst delivery performance.
- Western Europe had the highest total orders, but 55% of them were late deliveries.
– 5. Regional Revenue Insights
- Europe generated the highest revenue ($5,097,709) from customers purchasing for personal use.
- Africa, where most customers were small businesses, freelancers, or remote workers, generated the least revenue.
– 6. Customer Spending and Profit Patterns
- Among the top 10 customers, Mary Smith (Customer ID: 2083) from Caguas spent the most, followed by another Mary Smith (Customer ID: 791) from Canton.
- Among the top 10 customers, Betty Spears (Customer ID: 2641), from Carrollton generated the company the most profit, followed by Mary Smith (Customer ID: 2083) from Caguas.
– 7. Best & Worst Performing Products
Best-selling product:
- Perfect Fitness Perfect Rip Deck sold 73,698 units, generating $3,973,180 in revenue.
Worst-selling product:
- Bowflex SelectTech 1090 Dumbbells, with only 10 units sold.
Most profitable product:
- Field and Stream Sportsman 16 Gun Fire Safe made a profit of $756,220.67.
Least profitable product:
- SOLE E35 Elliptical made a loss of $965.12.
Findings from the Dashboard
The Year 2018 is left out for the dashboard because of the year to year comparison because 2018 has records for only January and not enough record to make comparison for that year. Some categories of products were ruled out for the analysis because they were recently introduced and lacks year by year records to make analysis. These categories are; As Seen on TV! , Baby, Basketball, Books, Cameras, CDs, Children clothing, computers, Consumer electronics, Crafts, DVDs, Golf Bags and Carts, Health and Beauty, Kids Golf clubs, Men’s Clothing, Men’s Golf Clubs, Music, Pet Supplies, Soccer, Sporting Goods, Strength training, Toys, Video Games, Women Clothing, Women’s Golf Club.
Sales Dashboard
2017 Analysis:
- Total Sales: $11.8M (4.03% decrease from 2016)
- Highest sales: September ($1.14M)
- Lowest sales: December ($0.50M)
- Total Profit: $1.30M (0.46% decrease from 2016)
- Highest profit: August ($132K)
- Lowest profit: December ($66K)
- Total Quantity Sold: 106K units (22.74% decrease from 2016)
- Highest quantity: March (11.7K units)
- Lowest quantity: November (2.1K units)
Category Performance:
- Sales declined for most product categories.
- Cleats had the highest profit in 2017.
Sales & Profit Trends:
- Weekly sales were mostly above the $233K average.
- Weekly profits were mostly above the $25K average.
2016 Analysis:
- Total Sales: $12.3M (0.30% decrease from 2015)
- Highest sales: August ($1.05M)
- Lowest sales: February ($0.97M)
- Total Profit: $1.31M (0.66% decrease from 2015)
- Highest profit: September ($123K)
- Lowest profit: February ($87K)
- Total Quantity Sold: 137K units (0.81% decrease from 2015)
- Highest quantity: October (11.9K units)
-
Lowest quantity: February (10.8K units)
Category Performance:
- 14 out of 24 categories saw a decline in sales.
-
Cleats was the most profitable category and none of the categories had a loss.
Sales & Profit Trends:
- Weekly sales were mostly above the $232K average.
- Weekly profits were mostly above the $25K average.
2015 Analysis:
- Total Sales: $13.2M
- Highest Profit Month: August ($118K)
- Lowest Profit Month: February ($99K)
- Total Quantity Sold: 138K units
- Highest quantity: March (12.1K units)
-
Lowest quantity: February (10.4K units)
Category Performance:
-
Cleats was the most profitable category and none of the categories had a loss.
Sales & Profit Trends:
- Weekly sales were mostly above the $233K average.
- Weekly profits were mostly above the $25K average.
Customer Dashboard
Customer Analysis (2015-2017)
2017 Analysis
Total Customers: 15.7K (48.3% increase from 2016)
- Highest in December: 2.1K
-
Lowest in February: 1.5K
Sales Per Customer: $779 (35.3% decrease from 2016)
- Highest in September: $706
-
Lowest in December: $237
Total Orders: 22K (4.8% increase from 2016)
- Highest in December: 2.12K
-
Lowest in February: 1.61K
Customer Distribution by Number of Orders:
- 10,714 customers placed only one order
- 2,787 customers placed two orders
- 1,159 customers placed three orders
-
A few customers placed four or more orders, with only two customers ordering seven or eight times.
Top Customer by Profit:
- Mary Spencer contributed the highest profit of $1,252 from seven orders.
2016 Analysis
Total Customers: 10.2K (0.9% increase from 2015)
- Highest in October: 1.7K
-
Lowest in February: 1.5K
Sales Per Customer: $1,205 (1.1% decrease from 2015)
- Highest in November: $654
-
Lowest in May: $619
Total Orders: 21K (0.2% decrease from 2015)
- Highest in October: 1.78K
-
Lowest in February: 1.65K
Customer Distribution by Number of Orders:
- 4,024 customers placed only one order
- 3,299 customers placed two orders
- 1,772 customers placed three orders, and so on.
Top Customer by Profit:
- Mary Lewis generated the highest profit of $1,298 from four orders.
2015 Analysis
Total Customers: 10.1K
- Highest in December: 1.7K
-
Lowest in February: 1.5K
Sales Per Customer: $1,219
- Highest in October: $642
-
Lowest in February: $618
Total Orders: 21K
- Highest in December: 1.81K
- Lowest in February: 1.59K
Discovery
SQL
- The USA and Puerto Rico dominate customer purchases, with 12,719 customers from the USA and 7,922 from Puerto Rico, despite a global presence.
- Cleats generated the highest revenue ($17,457,667), while CDs had the lowest revenue ($3,059).
- The top-selling product was the Perfect Fitness Perfect Rip Deck, selling 73,698 units and generating $3,973,180 in revenue.
- The least-selling product was Bowflex SelectTech 1090 Dumbbells, with only 10 units sold.
- Late deliveries were the most common issue, with Western Europe experiencing 55% late deliveries despite having the highest total orders.
- Central Africa had the worst delivery performance, with the fewest orders and high late delivery rates.
- Europe generated the highest revenue ($5,097,709), primarily from personal-use customers, while Africa generated the lowest revenue, where customers were mostly small businesses and freelancers.
- Mary Smith (Customer ID: 2083) was the highest-spending customer, followed by another Mary Smith (Customer ID: 791).
- Betty Spears (Customer ID: 2641) was the most profitable customer, followed by Mary Smith (Customer ID: 2083).
- The most profitable product was Field and Stream Sportsman 16 Gun Fire Safe, with a profit of $756,220.67.
- The least profitable product was SOLE E35 Elliptical, with a loss of $965.12.
Sales Dashboard
- Total sales have been declining over the years, with a 4.03% drop in 2017, a 0.30% drop in 2016, and a total decrease from 2015 to 2017.
- 2017 had the lowest sales performance, with $11.8M in total sales, a $500K drop in December, and a 22.74% decrease in total quantity sold compared to 2016.
- September 2017 had the highest sales ($1.14M), while December had the lowest ($0.50M), showing seasonal fluctuations.
- Profit has also seen a downward trend, with a 0.46% decrease in 2017 and 0.66% in 2016, reflecting a gradual decline in overall business profitability.
- Cleats remained the most profitable category across all three years, despite 14 out of 24 product categories seeing a decline in 2016.
- Weekly sales and profits were generally stable, consistently staying above $233K and $25K on average, suggesting a steady revenue stream despite overall annual declines.
- 2015 had the highest overall sales ($13.2M) and total quantity sold (138K units), making it the strongest year in the dataset.
- The lowest-performing month across the years was February, showing a recurring seasonal dip in sales and profits.
- Despite sales declines, the company maintained profitability, indicating potential opportunities for category optimization and seasonal marketing strategies to boost sales performance.
Customers Dashboard
- The number of customers grew significantly in 2017, with a 48.3% increase from 2016, reaching 15.7K customers.
- Despite customer growth, sales per customer declined, dropping 35.3% in 2017 to $779, compared to $1,205 in 2016 and $1,219 in 2015.
- Total orders increased slightly in 2017 (22K orders, up 4.8% from 2016), but the growth was not proportional to the customer increase, indicating more customers making fewer purchases.
- The majority of customers placed only one order per year, with 10,714 customers in 2017 making a single purchase, highlighting low customer retention and repeat purchases.
- Mary Spencer was the most profitable customer in 2017, generating $1,252 in profit from seven orders, while Mary Lewis led in 2016 with $1,298 from four orders.
- December had the highest customer count in both 2017 and 2015, while February consistently had the lowest customer activity across all three years.
- Sales per customer steadily declined from 2015 to 2017, indicating either lower spending per purchase or more budget-conscious customers.
- Customer engagement dropped, as fewer customers placed multiple orders over time. In 2015 and 2016, more customers placed two or more orders, while in 2017, most only placed one order.
- Customer growth did not translate into higher profits, suggesting an opportunity to improve customer retention strategies and increase average order value through targeted marketing and loyalty programs.
Recommendations
Customer Retention & Engagement
Implement a Loyalty Program – Encourage repeat purchases by offering discounts, rewards, or exclusive deals for returning customers. Personalized Marketing – Use customer purchase history to send targeted promotions and recommendations. Follow-up Campaigns – Send follow-up emails or special offers to one-time customers to boost retention.
Sales & Revenue Growth
Upselling & Cross-Selling – Suggest complementary products at checkout to increase order value. Bundle Deals & Discounts – Create product bundles or limited-time discounts to boost sales per customer. Improve Seasonal Marketing – Since February consistently had the lowest sales, run promotions or campaigns during slow months.
Category Optimization
Expand Profitable Product Categories – Cleats consistently generate high revenue; consider expanding this category. Phase Out Low-Performing Products – Review underperforming products like Bowflex SelectTech 1090 Dumbbells and CDs to optimize inventory.
Shipping & Delivery Improvements
Address Late Deliveries – Western Europe had the highest late delivery rate (55%). Improve logistics and work with better shipping partners. Improve Delivery to Underperforming Regions – Central Africa had the worst delivery performance; reassess shipping routes and options.
Customer Segmentation & Targeting
Focus on High-Value Customers – Customers like Mary Spencer and Mary Lewis contributed the highest profits; identify similar customers for targeted retention. Region-Specific Promotions – Europe generated the highest revenue from personal-use customers, while Africa had more small businesses and freelancers. Adjust marketing strategies accordingly.
Business Strategy for Long-Term Growth
Analyze the Decline in Sales Per Customer – Since sales per customer have dropped from $1,219 in 2015 to $779 in 2017, investigate potential reasons (e.g., pricing, competition, economic factors). Encourage Higher Order Frequency – Since most customers placed only one order per year, introduce subscription models or recurring purchase incentives. Invest in Product Quality & Customer Experience – Enhance product descriptions, customer reviews, and post-purchase engagement to build trust and long-term loyalty.
Conclusions
This project provides valuable insights into customer behavior, sales performance, and operational efficiency through data analysis and visualization. By leveraging SQL, Excel, and Tableau, I explored key trends in customer retention, product performance, shipping efficiency, and regional revenue distribution. The findings highlight areas for improvement, including enhancing customer engagement, optimizing product categories, addressing shipping delays, and refining marketing strategies to drive revenue growth. Implementing data-driven recommendations such as loyalty programs, personalized promotions, and inventory adjustments will help increase profitability and customer satisfaction.